
CLICK SHIP IMAGE AND READ THEN READ BELOW URL:
http://www.nauticalcharts.noaa.gov/mcd/docs/Draft_Arctic_Nautical_Charting_Plan.pdf
Introduction
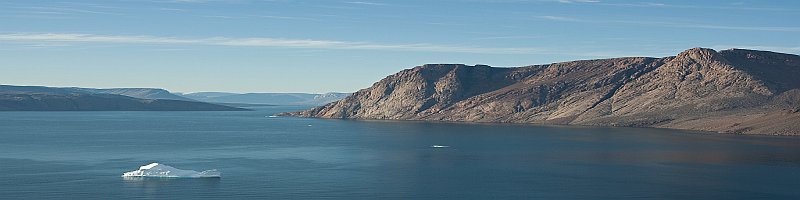
The Arctic’s wealth in natural resources is matched only by its inherent beauty. The Arctic coast of Alaska has a general length of 921 nautical miles and the mostly low tidal shoreline totals 2,191 miles.
To ensure sustainable marine transportation throughout the Arctic, an infrastructure that supports safety, environmental protection, and commercial efficiency must be constructed. Modern nautical charts of the appropriate scale can provide the foundation for improving transportation in the area. They will also supply the base geospatial data used by federal, state, and local entities in fishery stock assessments, coastal zone management, energy exploration and other uses.
It is a treasure that contains considerable economic resources, including oil, natural gas, and minerals. It also has a potential northern shipping route that would significantly reduce the time and energy used in transit between the Pacific and Atlantic Oceans.
Additional NOAA nautical chart coverage will enhance the American Arctic Marine Transportation System by depicting shoreline, depths, hazards and recommended routes throughout the region. Currently, charting data in much of the arctic is woefully out of date or nonexistent. According to the U.S. Coast Pilot, much of the Bering Sea area is “only partially surveyed, and the charts must not be relied upon too closely, especially near shore. The currents are much influenced by the winds and are difficult to predict; dead reckoning is uncertain, and safety depends upon constant vigilance.”
It is time to build the foundation for marine transportation in the Arctic.
This is the first Office of Coast Survey nautical charting plan devoted exclusively to the Arctic. It presents an overview of the many drivers that have brought the need for a more robust maritime transportation infrastructure to the forefront. It provides detailed plans for the layout of additional nautical chart coverage and describes the requisite activities needed to build and maintain these charts. It supports the recommendations of the Interagency Ocean Policy Task Force and NOAA’s Arctic Vision & Strategy
NOAA is responsible for providing nautical charts for most of the nation, with a suite of over 1000 charts encompassing the coasts of the U.S., the Great Lakes, and the U.S. territories. The National Geospatial-Intelligence Agency (formerly NIMA) is responsible for producing deep water and charts in foreign waters. The U.S. Army Corps of Engineers produces charts on the Mississippi River and other inland waterways.
The International Hydrographic Organization defines hydrography as “the branch of applied science which deals with the measurement and description of the physical features of the navigable portion of the earth’s surface [seas] and adjoining coastal areas, with special reference to their use for the purpose of navigation.”
Hydrographic surveying “looks” into the ocean to see what the sea floor looks like.
Hydrographic surveys support a variety of activities: nautical charting, port and harbor maintenance (dredging), coastal engineering (beach erosion and replenishment studies), coastal zone management, and offshore resource development. Most surveys are primarily concerned with water depth. Of additional concern is the nature of the sea floor material (i.e. sand, mud, rock) because of the implications for anchoring, dredging, structure construction, pipeline and cable routing and fisheries habitat.
The Office of Coast Survey (OCS) conducts hydrographic surveys to measure the depth and bottom configuration of water bodies. We use the data to produce the nation’s nautical charts and ensure safe navigation in U.S. coastal waters and the Exclusive Economic Zone.
Surveyors pay particular attention to acquiring the precise location of least (shoalest) depths on dangers to navigation and depths significant to surface navigation. They record the precise location of aids to navigation. Tide or water level measurements are also recorded to provide a vertical reference (Mean Lower Low Water) for water depths.
OCS conducts hydrographic surveys primarily with side scan and multibeam sonar. SONAR (SOund NAvigation and Ranging) uses sound waves to find and identify objects in the water and to determine water depth. Most survey vessels are equipped with side scan and multibeam sonar systems. Some vessels use single beam echo sounders, divers least depth gauges, and lead lines. Some contractors employ LIDAR, which uses light to determine objects in the water and water depth.
NOAA and outside contractors usually complete about 70 to 80 hydrographic surveys each year.
The data is collected and processed digitally with specialized computer systems that store the data in digital form. Chartmakers use the data, with shoreline information, to update nautical charts and generate graphic displays in both digital and hardcopy form.
Hydrographic data collected by and for OCS is publicly available to the broader scientific and oceanic community. Contact NOAA’s National Geophysical Data Center for more information.
Side Scan Sonar
The Office of Coast Survey conducts hydrographic surveys primarily with side scan and multibeam sonar. SONAR (Sound Navigation and Ranging) uses sound waves to find and identify objects in the water and determine water depth.

Side scan sonar is a specialized sonar system for searching and detecting objects on the seafloor. Like other sonars, a side scan transmits sound energy and analyzes the return signal (echo) that has bounced off the seafloor or other objects. Side scan sonar typically consists of three basic components: a towfish, a transmission cable and the topside processing unit. In a side scan the transmitted energy is formed into the shape of a fan that sweeps the seafloor from directly under the towfish to either side, typically to a distance of 100 meters.
The strength of the return echo is continuously recorded creating a "picture" of the ocean bottom. For example, objects that protrude from the bottom create a light area (strong return) and shadows from these objects are dark areas (little or no return) as in the image at left above, or vise versa, depending on operator preference. While the shape of the seafloor and objects on it can be well- depicted, most side scan systems can not provide any depth information.
Differences Between Maps & Charts
A chart, especially a nautical chart, has special unique characteristics including a very detailed and accurate representation of the coastline, which takes into account varying tidal levels and water forms, critical to a navigator.
A map emphasizes land forms, including the representation of relief, with shoreline represented as an approximate delineation usually at mean sea level.
A chart is a working document. It is used to plot courses for navigators to follow in order to transit a certain area It takes into account special conditions required for one's vessel, such as draft, bottom clearance, wrecks and obstructions which can be hazardous. Way points are identified to indicate relative position and points at which specific maneuver such as changing courses, must be performed.
A map is a static document which serves as a reference guide. A map is not, and can not be used to plot a course. Rather it provides a predetermined course, usually a road, path, etc., to be followed. Special consideration for the type of vehicle is rarely a consideration. Further, maps provide predetermined points-road intersections-to allow one a choice to change to another predetermined direction
Charts provide detailed information on the area beneath the water surface, normally not visible to the naked eye, which can and is very critical for the safe and efficient navigation.
Maps merely indicate a surface path providing no information of the condition of the road. For instance a map will not provide information on whether the road is under repair (except when it is a new road) or how many pot holes or other obstructions it may contain. However the driver is able to make a visual assessment of such conditions.
NOAA hydrographic survey units use side scan sonar systems for both object detection and object recognition. Side scan sonar is typically used in conjunction with a single beam or multibeam sonar system to meet full bottom coverage specifications for OCS surveys. NOAA field units use various models of side scan sonar in both hull mounted and towed configurations for hydrographic survey operations. Any side scan sonar system employed must meet the specifications outlined in the “NOS Hydrographic Surveys Specifications and Deliverables”.
Maps merely indicate a surface path providing no information of the condition of the road. For instance a map will not provide information on whether the road is under repair (except when it is a new road) or how many pot holes or other obstructions it may contain. However the driver is able to make a visual assessment of such conditions
The Office of Coast Survey conducts hydrographic surveys primarily with side scan and multibeam sonars. SONAR (Sound Navigation and Ranging) uses sound waves to find and identify objects in the water and determine water depth.
Multibeam echo sounders (MBES), like other sonar systems, transmit sound energy and analyze the return signal (echo) that has bounced off the seafloor or other objects. Multibeam sonars emit sound waves from directly beneath a ship's hull to produce fan-shaped coverage of the seafloor. These systems measure and record the time for the acoustic signal to travel from the transmitter (transducer) to the seafloor (or object) and back to the receiver. Multibeam sonars produce a “swath” of soundings (i.e., depths) to ensure full coverage of an area. The coverage area on the seafloor is dependent on the depth of the water, typically two to four times the water depth.
Many MBES systems are capable of recording acoustic backscatter data. Multibeam backscatter is intensity data that can be processed to create low resolution imagery. Backscatter is co-registered with the bathymetry data and is often used to assist with bathymetric data interpretation and post-processing.
NOAA hydrographic survey units use multibeam echo sounder systems to acquire full- and partial- bottom bathymetric coverage throughout a survey area, to determine least depths over critical items such as wrecks, obstructions, and dangers-to-navigation, and for general object detection. NOAA field units use various models of swath-type multibeam systems both hull and pole mounted for hydrographic survey operations. The use of multibeam echo sounder systems must meet specifications outlined in the "NOS Hydrographic Surveys Specifications and Deliverables".


As the new year approaches, NOAA ships and independent contractors are preparing for the nation’s 177th hydrographic surveying season, aiming to collect critically needed ocean and coastal mapping data for 2,525 square nautical miles in high-traffic coastal waters of the continental United States and Alaska.
“The science of these surveys underpins the steady flow of commerce and the safety of mariners and coastal communities,” said NOAA Corps Capt. John E. Lowell, director of the Office of Coast Survey and U.S. national hydrographer. More than 13 million jobs are tied to maritime commerce which contributes more than $742 billion to the American economy.
U.S. waters cover 3.4 million square nautical miles including a constantly changing coastal environment due to storms, erosion and other coastal processes. To ensure the continued flow of commerce, NOAA’s Office of Coast Survey maintains the nation’s suite of more than 1,000 nautical charts. To ensure the accuracy of charts, the Office of Coast Survey annually plans hydrographic survey projects to update depths and identify new navigational hazards on the seafloor. Requests by marine pilots, port authorities, the Coast Guard, researchers and others are considered when setting the year’s schedule.
The surveys planned for 2011 will acquire data to update the country’s nautical charts, especially where marine transportation dynamics are changing rapidly. For instance, NOAA Ships Fairweather and Rainier plan to survey the coasts of Alaska in areas increasingly transited by the offshore oil and gas industry, cruise liners, ferries, military craft, tugs and barges, fishing vessels and factory trawlers.
Safety concerns also play a large role in project selections. One such project covers an area in the Strait of Georgia, Wash., where the largest oil tanker terminal in the state has recently doubled its capacity. In the Chesapeake Bay, data collected by NOAA Ship Thomas Jefferson will help address concerns about impacts of a planned pipeline. In addition, this project will provide broader benefit to the region.
“The timing for the southern Chesapeake Bay survey is really great — not only for commercial shipping but also for Operation Sail 2012,” said Captain Bill Cofer, president of the Virginia Pilots Association. The historic ship celebration could generate more than $150 million for the state through tourism and related activities.
Thomas Jefferson will also survey in eastern Long Island Sound to ensure that no navigational hazards exist in proposed anchorage grounds — areas for vessels to anchor while awaiting transit into ports in the area — while also supporting other ocean mapping initiatives in New York and Connecticut.
Because nautical charting surveys depict changes on the coastal ocean floor as well as depths and obstructions, the data is increasingly used by coastal managers to better understand ecosystem habitat, fisheries management and coastal planning. Surveys in Alaska, for example, will help build tsunami inundation digital elevation models for the state, and support the creation of digital seafloor maps for use by longline and pot fisheries.
No comments:
Post a Comment