In this current article I am going to discuss the Gulf Stream and meltwater.
The Gulf Stream in the Arctic
Most diagrams of the Gulf Stream show it looping back somewhere near the southern tip of Greenland. That presents a false picture of one of the major influences on Arctic climates in the North Atlantic sector of the Arctic.
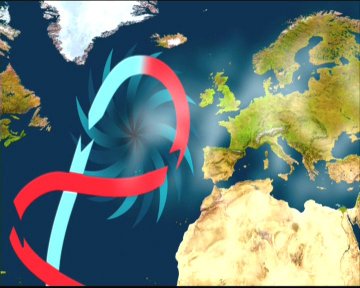
Credit: Al Gore's 'An Inconvenient Truth'.
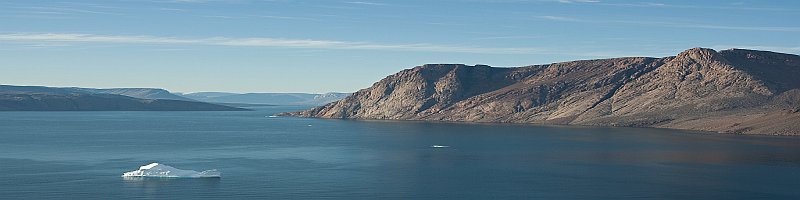
If the Gulf stream lost its heat to atmosphere and warmed Europe as shown in the diagram then it would have nothing left to contribute to Arctic climates. I have previously referred to Richard Seager's take on this. The Gulf stream, retaining most of its warmth, continues North, dividing as it goes. One part flows past scandinavia where it makes the port of Hammerfest ice-free all year round. Another part flows into the Fram Strait between Greenland and Iceland, where its course is affected by the shape of the sea bed, by ice and by meltwater. Other flows will be discussed in a later article.
When streams or layers of ocean water interact, they do so more like a river running over loose sand than like two lots of water freely mixing. There is some exchange of water and temperature, but generally the layers slide over and under one another. If a video could be made of cold water pouring into an Arctic basin deep beneath the surface it would put Niagara Falls in the shade.
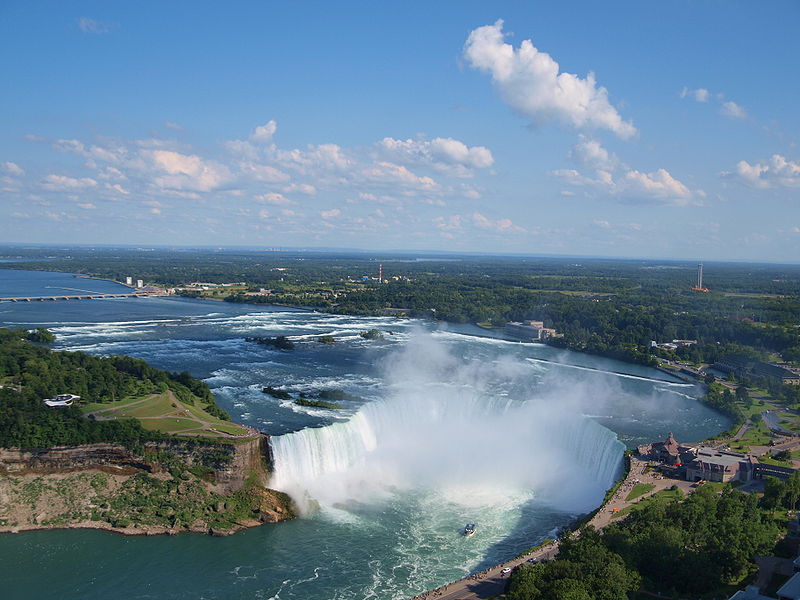
Canadian Horseshoe Falls with city of Buffalo, US in background. Clicked from Skylon Tower, Niagara Falls, Canada.
image: courtesy Ujjwal Kumar
Flow rates in Sverdrups
When dealing with volumes of water at the oceanic scale, calculations are made simpler by measuring volumes in Sverdrups. Named in honour of the oceanographer Harald Sverdrup, the unit is used mainly to measure the amounts of water transported by ocean currents.
One Sverdrup - 1.0 Sv - is equivalent to 106 cubic metres per second. That's 0.001 cubic kilometers, about 264 million U.S. gallons or about 139 cubic yards.
More than 168,000 m³ of water falls over Niagara's crest every minute at peak flow, and nearly 110,000 m³ on average. Niagara is the most powerful waterfall in North America. But it would take about 357 Niagaras to make just 1 Sverdrup.
The entire global input of fresh water from rivers to the ocean is usually stated as about 1 sverdrup.
The Arctic Ocean has only two points of entry or exit for its currents: the Bering Strait and the North Atlantic. The flow of water into the Arctic via the Bering Strait is of the order of 1 Sv. By way of comparison, the part of the Gulf Stream which flows into the Arctic is of the order of 8.5 Sv.
The oceanic fluxes of mass, heat and salt that pass north across the Greenland–Scotland Ridge from the Atlantic to the Arctic Mediterranean have now been soundly established by direct measurement under the EC VEINS and ASOF/MOEN programmes, as have the corresponding fluxes to the Arctic Ocean (Ingvaldsen et al. 2004a, b; Schauer et al. 2004). We now know that the 8.5 million cubic metres per second of warm salty Atlantic Water that passes north across this Ridge carries with it, on average, some 313 million megawatts of power and 303 million kilograms of salt per second (Østerhus et al. 2005). As it returns south across the Ridge in the form of the two dense overflows from Nordic Seas, its salinity has decreased from about 35.25 to 34.88 and its temperature has dropped from 8.5 °C to 2.0 °C or less. Not surprisingly, surrendering this amount of heat is of more than local climatic importance.
http://www.springerlink.com/content/p817k8141473v711/
Warm water and meltwater
In historical times the navigable part of the Fram Strait was, even at the best of times, reduced to about 25% of the entire strait due to extensive Greenland shelf ice. In recent decades that figure has risen to about 50%. This year - 2010 - Greenland looks set to have no remaining shelf or shorebound ice on its Eastern seaboard.
There seems to be a feedback mechanism at work here: as the ice-free part of the strait gets wider it is able to transport more ice to the South where it melts rapidly. The question is: why is it getting wider?
Popular articles on Arctic Gulf stream flow have often made the assumption that either the Gulf stream travels under cold water or it travels under ice, thereby losing heat. Sea ice rejects salt back into the ocean, thereby increasing salinity locally. Increased salinity and density cause water to sink. On the larger scale, this is what drives the thermohaline circulation. But what happens on a smaller scale?
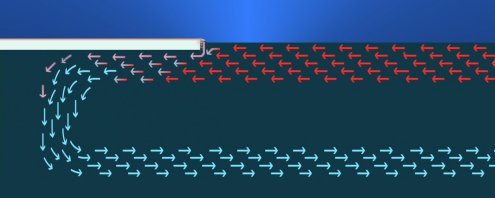
I suggest that meltwater can operate as a negative or a positive feedback, slowing or increasing the rate of ice loss in Arctic Summer. A fairly traditional image of what happens when warm water meets the edge of sea ice is shown below.
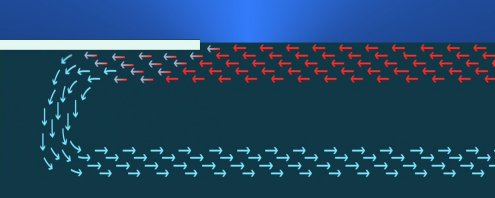
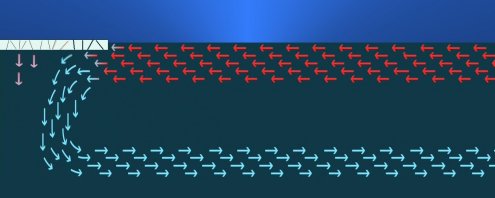
That flow may be fairly true in Winter, but in Summer there can be substantial amounts of meltwater. The next image shows a suggested flow where warm water meets meltwater.
The meltwater is shown acting as a buffer between ice and warm water, slowing down the rate of ice loss from bottom or edge warming.
In Arctic Summer, when a large expanse of continuous ice begins to melt at the surface, the water streams from the edge into the sea. This meltwater creates a cold buffer zone - my terminology - between the warm sea water and the ice edge when the cold fresh water mixes with or overlays the warm saline waters. At the edges of vast ice sheets the water can cascade down with such force as to create a vertical buffer zone.
If, for whatever reason, the ice is penetrated by cracks, the meltwater fails to reach the ice edge. Melt rate from the contact with warm water accelerates. The warm water remains in substantial contact with ice until it meets meltwater.
Shorebound continuous ice and shelf ice discharge their meltwater over the edge, creating a buffer zone of cold water. Warm water flowing past does not actually contact the edge of the ice, perhaps not even the outer boundary of the pack ice. It is possible that the meltwater from glaciers and sheet ice helps reduce the melt rate of looser pack ice by reducing the penetration of warm sea water into the pack. Ice loss will thus be mainly due to offshore winds driving floes out into warmer water. The next image shows a suggested mechanism whereby the meltwater from shorebound ice prevents penetration of warm water under the ice.
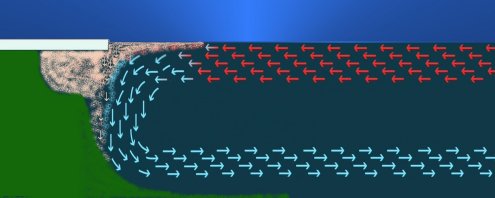
If the sea ice cracks then the meltwater fails to form a boundary layer. Anything which generates cracks in sheet ice allows the meltwater to flow into the sea before it reaches the outer ice margins. This is, I suggest, a positive feedback with multiple impacts. The outer margins and the compacted pack ice no longer benefit from a cold, fresh, meltwater buffer zone. Cracks in the ice increase the amount of local sea surface, thus reducing albedo. Exposure of edges to sun-warmed open leads increases the melt rate. Melting floes reduce in area. This allows greater mobility, hence greater momentum. More impacts in warmer water lead to greater fragmentation and a cycle of exchanges of energy which ends only when all the sea ice in the zone has melted or the Winter freeze begins.
Currently the thaw season begins about three weeks early and ends about four weeks late. The lower ice recovery in the shorter freeze period, coupled with the extended melt season, create a feedback mechanism whereby every passing year shows a trend towards total sea ice loss. Thinner, younger ice is more prone to fragmentation. It is exported South through ever widening channels. The ultimate channel size is, of course, bounded by the land. The Fram Strait is the major outlet for polar ice. For as long as it was partially blocked by well consolidated shorebound ice it was limited in how much ice it could export in a single season. To the best of my knowledge it has never previously been 100% open to broken ice being driven South.
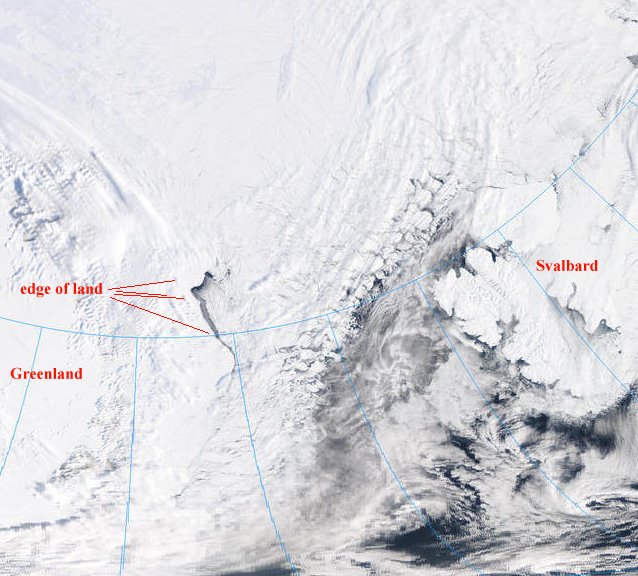
MODIS image of Fram Strait, cropped and rotated, 2km resolution - April 2010.
Note: due to NASA MODIS server problems I have been unable to get the exact date and time of this recent image. It is from approx April 20. I will edit in the details as soon as possible.
Edit: added images, delayed due to NASA server problems.
The above image, showing broken ice flowing out of the Fram Strait in April should be compared with the images and months below.
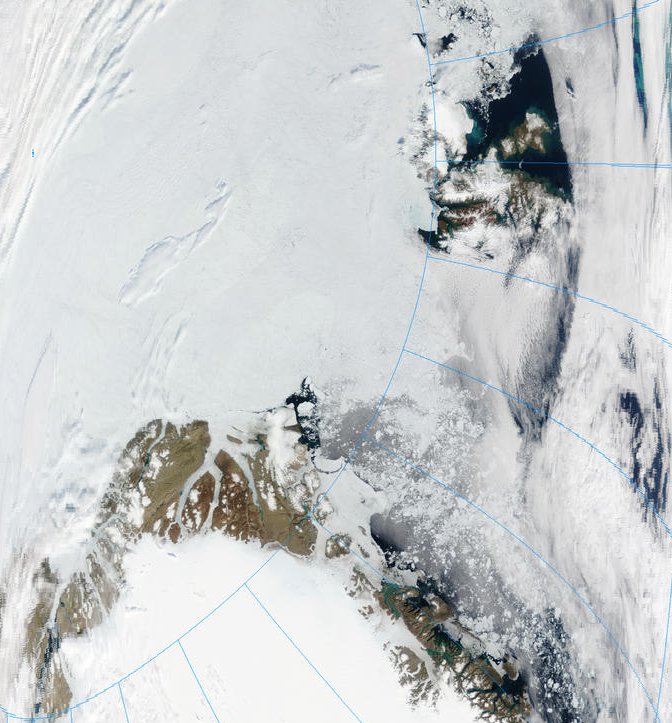
Cropped image shows ice flowing out of Fram Strait.
Note, allowing for illusion due to cloud, the continuous ice cover immediately North of the Strait.
July 22 2003 - MODIS/Terra 2003/203 07/22/03 15:05 UTC 2km resolution.
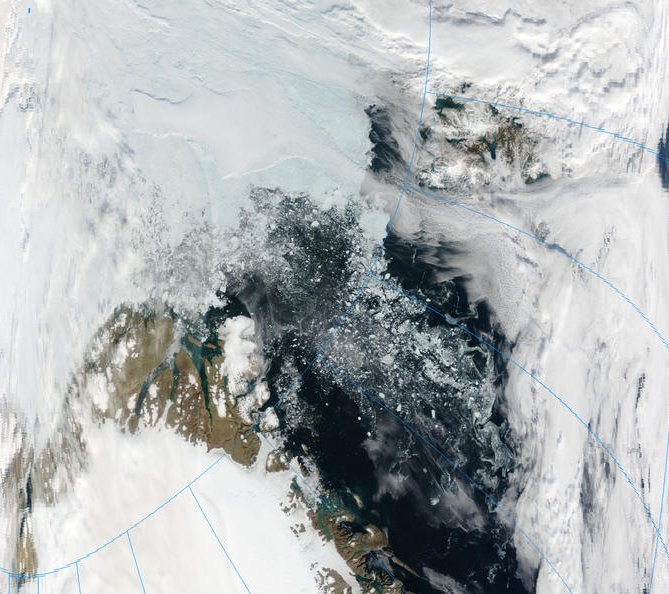
Cropped image shows ice flowing out of Fram Strait.
Ice immediately to North of the Strait is thinning but still continuous.
August 20 2003 - MODIS/Terra 2003/232 08/20/03 14:35 UTC 2km
In due course I plan to discuss if, where, and how the Gulf stream might modify its behaviour as Arctic ice losses affect it.
Continued on next post
MODIS images courtesy NASA
http://rapidfire.sci.gsfc.nasa.gov
No comments:
Post a Comment